The site speed analyzer that shows you exactly why your site is slow
Knotvo brings your browser's network capture (HAR) and live measurement into one screen, then tells you what to do about it — with a plain to-do list rather than opaque scores. No account to create, no queue to wait in, and your data never leaves your machine.
🍎 Coming soon to the Mac App Store · macOS 14+ · Apple Silicon and Intel
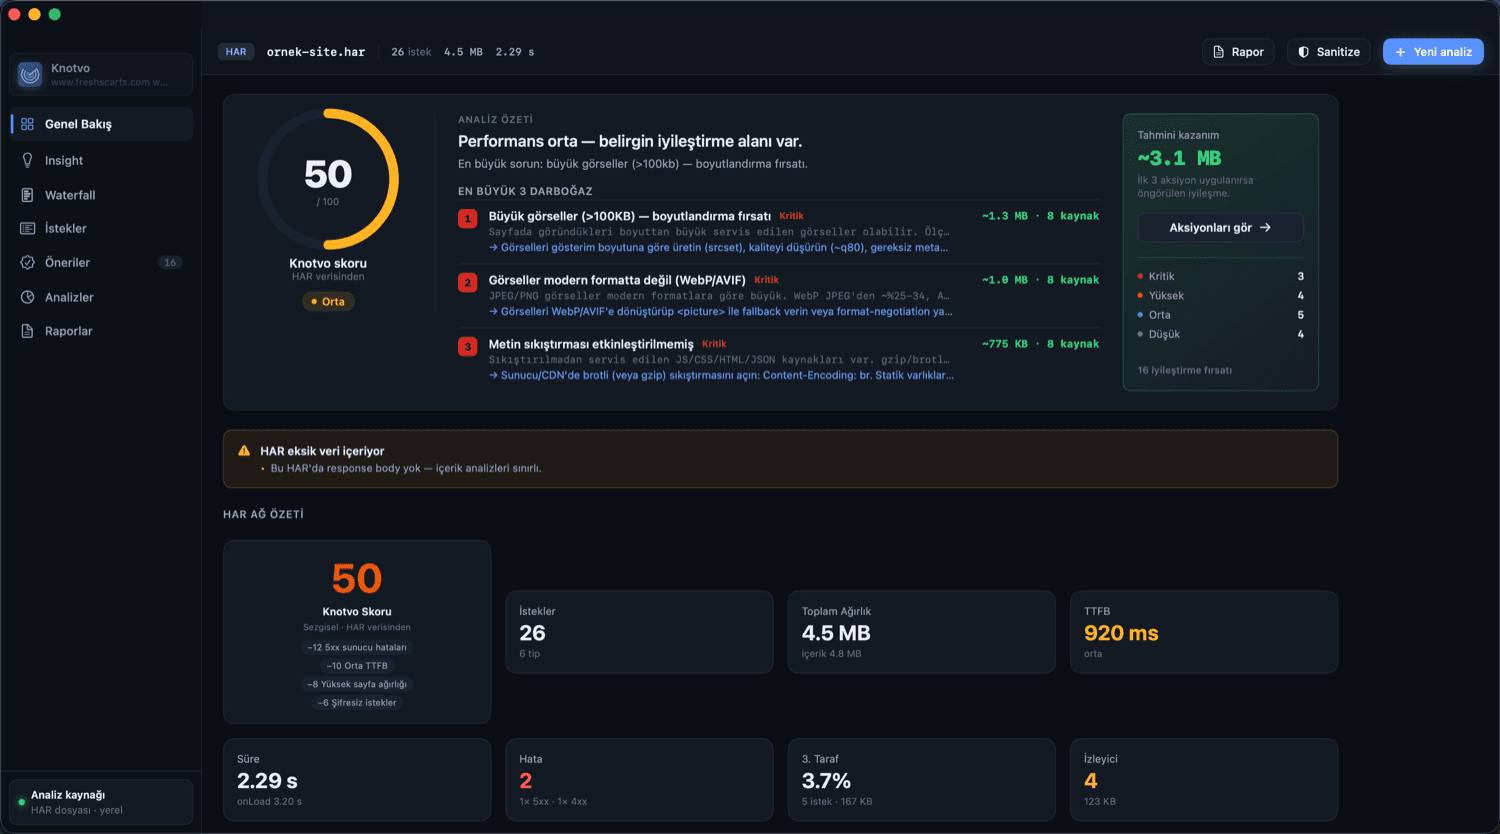
Your site's health at a glance
The performance score, the three bottlenecks costing you the most time, and the estimated gain from completing the top three fixes — all on one screen, colour-coded by priority.
- A “why this score” explanation next to the number
- Findings ordered from critical to low
- Estimated byte and time savings for every finding
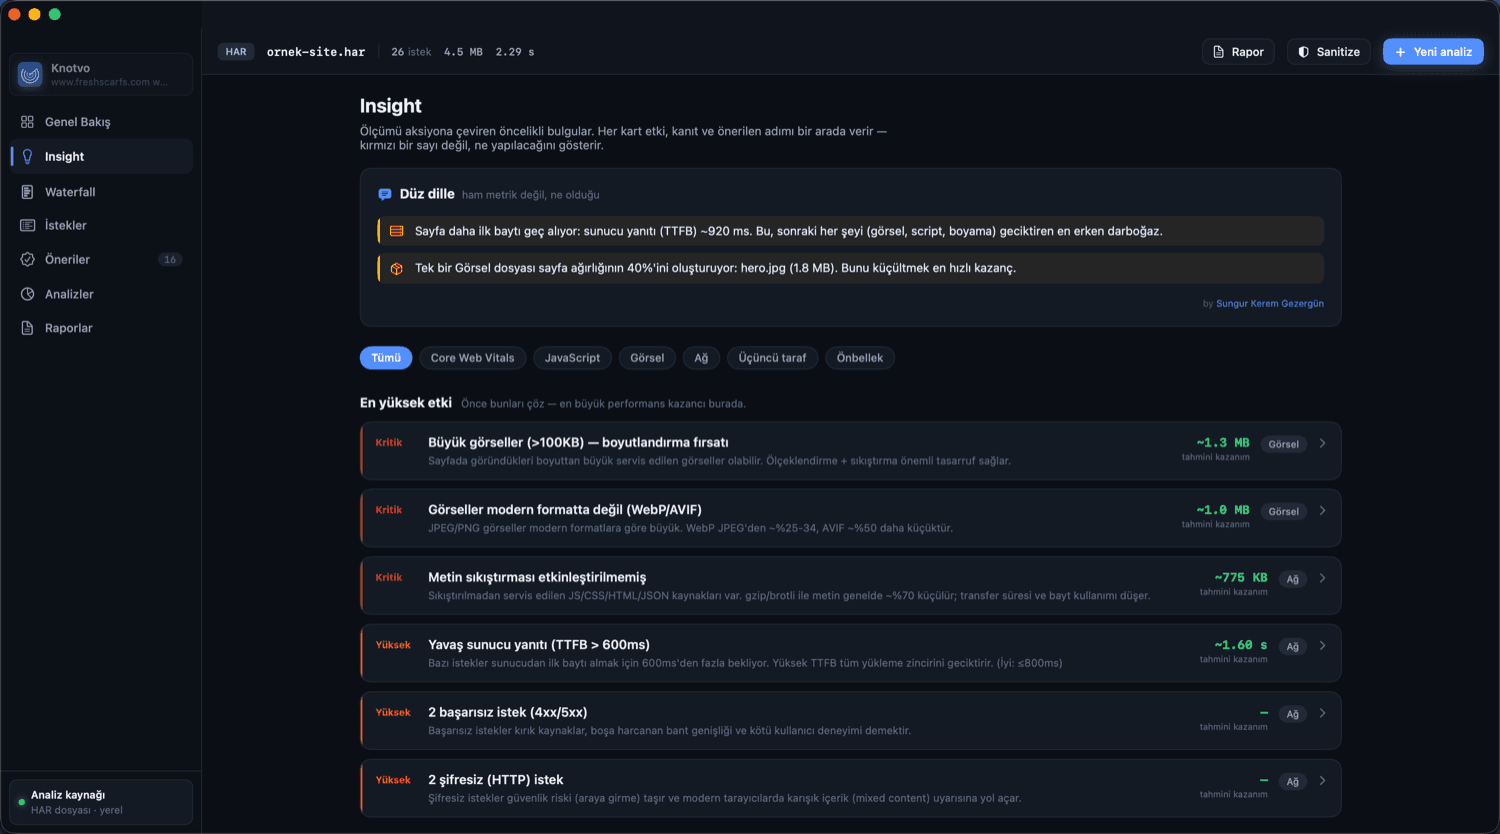
Not raw metrics — what you need to do
Most tools hand you a pile of numbers and leave the interpretation to you. Knotvo writes plain sentences instead: “the page receives its first byte late; the real problem is server response”. You can show it to your manager or client as-is.
- Readable even by someone non-technical
- Catches misdiagnoses too, such as a late-loading hero image
- Filter by category: images, JavaScript, network, cache
Measurement, step by step
Enter a live address and Knotvo runs the measurement through Google PageSpeed Insights and Lighthouse, collects real-user data (CrUX) and turns all of it into a single report in roughly half a minute. You see each step as it happens.
- Choose a mobile or desktop profile
- Cancel at any point
- Land straight on the results screen when it finishes
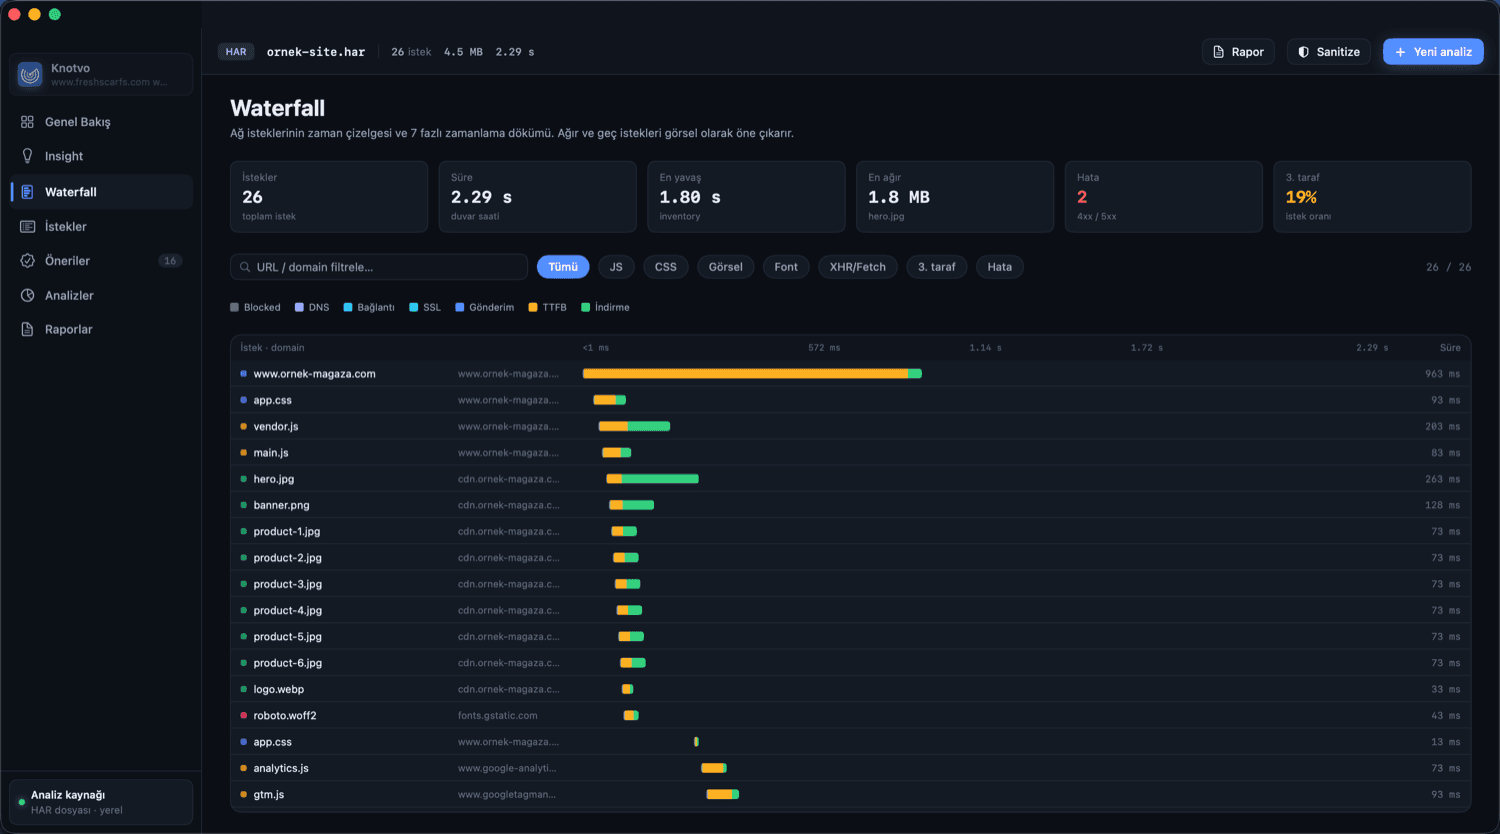
Where every request loses time
The waterfall breaks each request into seven phases and highlights visually how long it waited, how long it took and how heavy it was. Slow, heavy requests stand out immediately.
- A sortable request table
- Waiting, connecting and downloading shown separately
- Third-party and tracker load made obvious
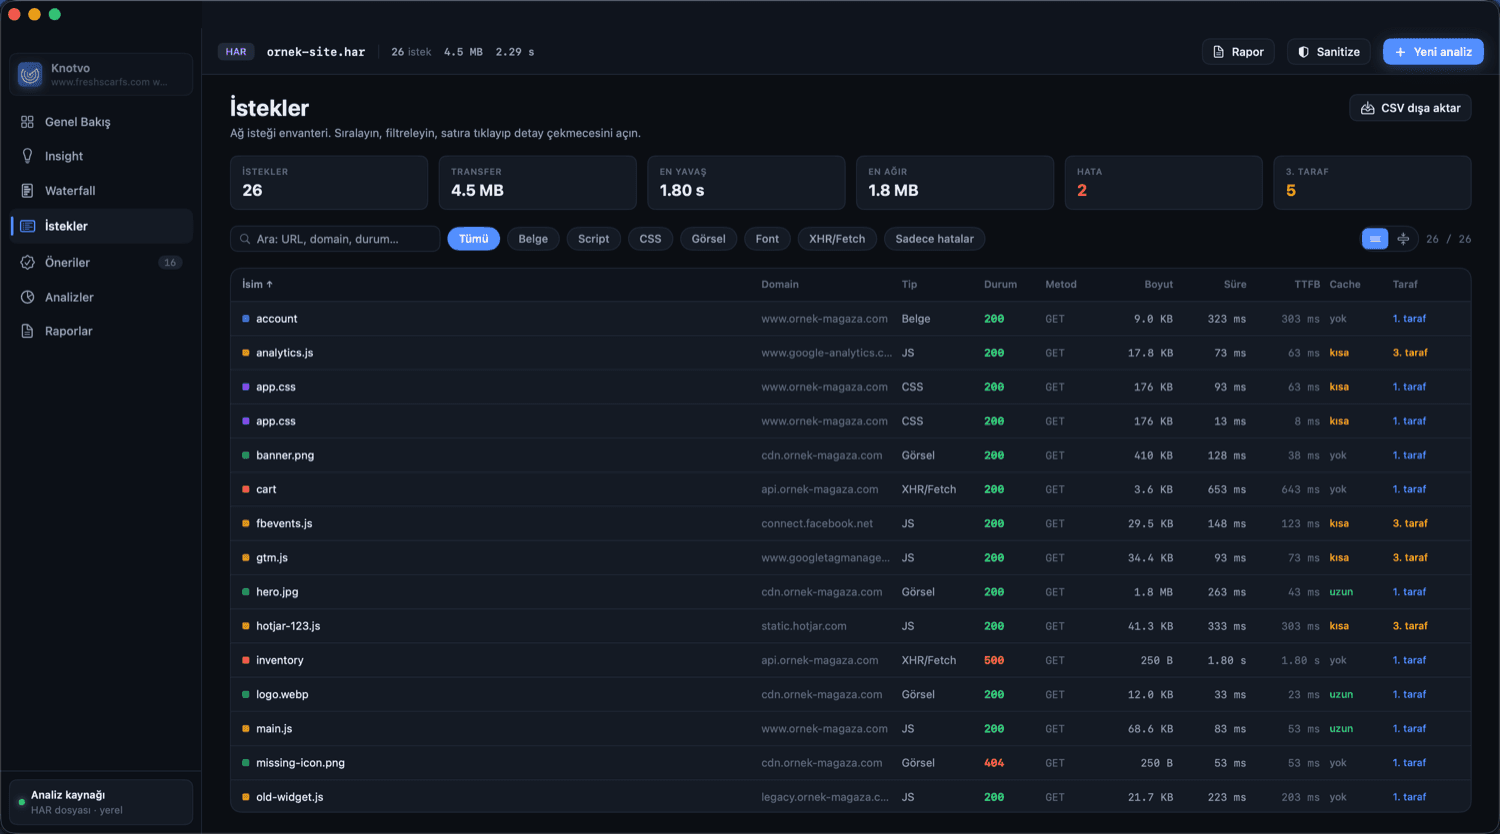
Every request in one filterable table
Sort by size, duration, type and status; filter by URL or domain. Click a row to open that request's full detail in the side panel.
- Heaviest requests by size and by duration
- Headers, priority, initiator and timing
- Export as CSV
A report you can send to a client
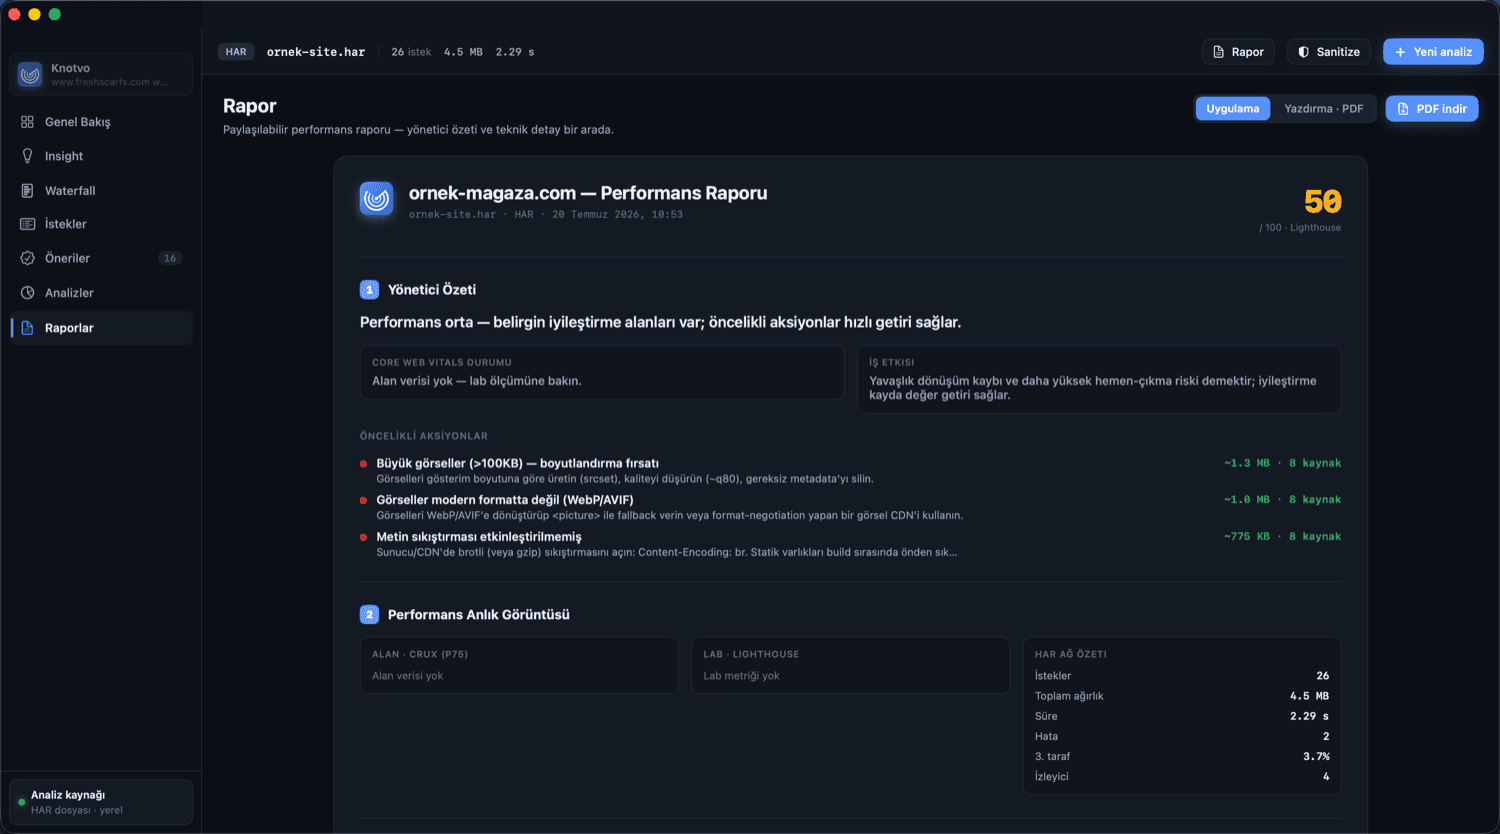
Executive summary and technical detail in a single document. Save it as a PDF in one click and send it to your team or your client — ready for an agency presentation.
- Business impact and Core Web Vitals status together
- Prioritized actions and quick wins
- Dark theme or a print-friendly light theme
The whole workflow in one application
Every step from measurement to sharing lives here. No other site speed analyzer packages all of this together.
Lab and field, side by side
It ends the “score is 100 but Core Web Vitals fails” confusion. Real-user data sits next to the Lighthouse measurement, with a note on which one affects search.
Safe sharing
HAR files carry live session data. One click strips cookies, authorization headers and tokens and produces a share-safe copy. Your original file is untouched.
Compare two HAR files
Load a capture from before and after a release and see the difference. Did weight go up? Did a new error appear? You will know in seconds.
Brand workspace
Manage multiple brands, keep the history of each site and schedule a weekly automatic scan. Get notified when a score drops.
Multi-URL comparison
Measure several addresses at once and compare them in one table. Put your page next to its peers.
Private by default
HAR analysis is entirely local and nothing goes to the cloud. Only the address you enter for live measurement is passed to Google, and that is stated clearly.
What makes your day-to-day easier
How Knotvo compares with other tool types
There are three groups of tools on the market and none of them sits exactly where Knotvo does. The table below compares by category rather than naming brands.
| Capability | Knotvo | Cloud speed test tools | Network capture tools | Free HAR viewers |
|---|---|---|---|---|
| Turns a HAR into a to-do list | yes | no | no | no |
| Compare two HAR files | yes | no | no | no |
| Test localhost and staging | yes | no | partial | partial |
| Sanitize secrets for safe sharing | yes | no | no | basic |
| No account or login required | yes | no | yes | yes |
| No quotas or queues | yes | no | yes | yes |
| Data stays on your device | yes | no | yes | varies |
| Lab and real-user data together | yes | separate | no | no |
In short: cloud tools measure performance, but only on public addresses and only with an account and a quota. Network capture tools show you the requests but do not interpret performance. Free viewers open a HAR but produce no recommendations. Knotvo brings the useful parts of all three into one application that runs on your own machine.
What people ask
What exactly does Knotvo do?
It is a site speed analyzer. It inspects HAR files and live measurements, analyses network requests, Core Web Vitals and third-party load, and turns all of it into a prioritized to-do list.
Does my data go to the cloud?
HAR analysis happens entirely on your machine and nothing is uploaded. Only when you use live measurement is the address you enter sent to Google PageSpeed Insights, and the app states this clearly.
Can I test localhost or staging?
Yes. Capture a HAR in your browser and open it in Knotvo. Unlike cloud tools it can analyse internal and private pages. Live measurement, however, only works on public addresses.
Can I safely share a HAR that contains secrets?
Use the Sanitize feature. It strips cookies, authorization headers and tokens and produces a share-safe copy. Your original file is left untouched.
Which devices does it run on?
Knotvo is currently a Mac application requiring macOS 14 or later. It supports both Apple Silicon and Intel processors.
Be the first to know when Knotvo ships
Coming soon to the Mac App Store. If you want to hear about it at launch, one email is all it takes.
Notify me